

Technical Analysis vs Price Action
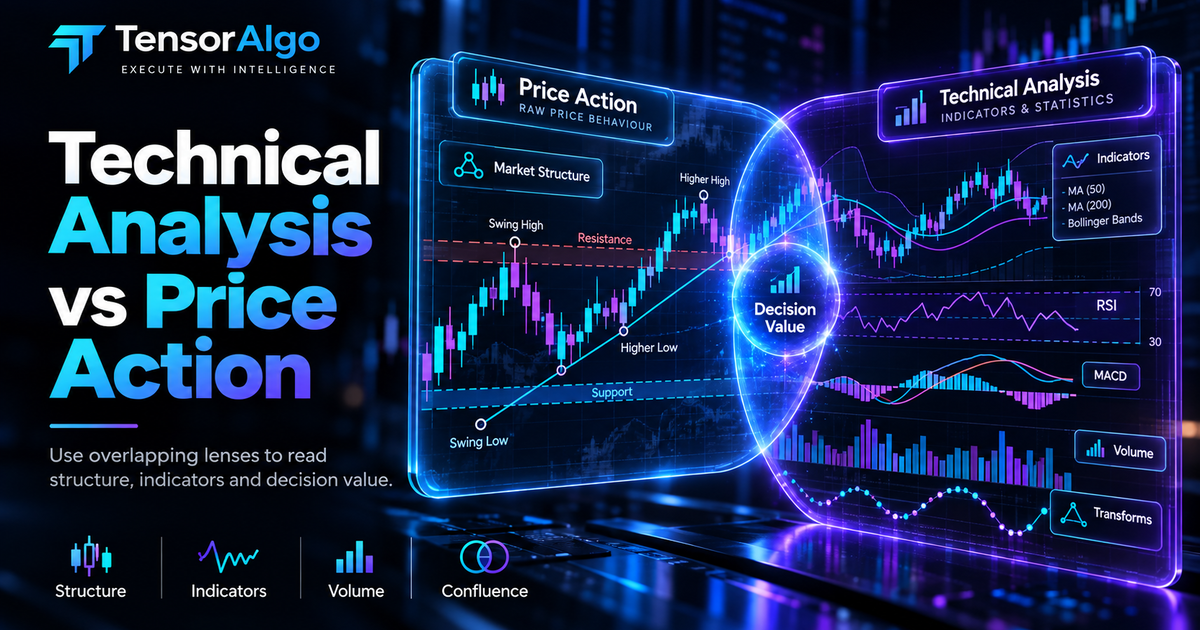
Price action and technical analysis are overlapping lenses, not opposing camps. Compare raw market structure with indicators, volume and statistical transforms, then combine only the evidence that adds distinct decision value.
Technical Analysis vs Price Action: What's the Difference?
Technical analysis and price action are often presented as competing approaches, but they overlap. Price action is itself a form of market analysis based primarily on observed price behavior, while technical analysis is a broader category that can include indicators, volume, statistical transforms, chart patterns, and price structure.
Educational information only. No analytical method guarantees profitable trading.
What is price action?
Price-action traders focus on observable behavior such as:
- highs/lows;
- ranges and breakouts;
- reclaims/rejections;
- trend structure;
- gaps;
- support/resistance references;
- candlestick/bar behavior;
- response around prior levels.
The interpretation can be highly discretionary unless terms are precisely defined.
What is technical analysis?
Technical analysis uses market-derived data to study behavior and structure. It can include price action plus:
- moving averages;
- RSI and momentum measures;
- ATR/volatility;
- VWAP;
- volume profile;
- market profile;
- breadth;
- statistical indicators.
Indicators are transformations of data, not independent sources of truth.
Lag is not automatically bad
Many indicators use historical observations and therefore react rather than predict. Price-action structures also require observations before they can be identified.
The useful question is not “does it lag?” but whether the information improves a defined decision at the required horizon.
Example: VWAP plus price action
A trader might use VWAP to define location and price behavior to define the trigger:
- context: price has traded below session VWAP;
- setup: price returns to VWAP;
- trigger: predefined rejection behavior;
- invalidation: acceptance above the reference;
- risk: sized from the invalidation.
Here the indicator and price action have different jobs.
Example: volume profile plus structure
A volume-profile level can identify an area of interest while price behavior determines whether the market accepts or rejects that area.
Avoid assuming that a level must cause a reversal. It is a reference around which behavior can be observed.
Price action can overfit too
Discretionary chart reading is not immune to hindsight. Humans are excellent at seeing patterns after an outcome is known.
Define terms before reviewing results and preserve screenshots/data from decision time.
Indicator stacking
Adding RSI, moving averages, MACD, stochastic oscillators, and other correlated transformations can create an illusion of confirmation because several indicators may be responding to the same underlying price movement.
Each input should contribute distinct information or serve a clearly defined role.
Order flow is another layer
DOM, Time & Sales, cumulative delta, and volume-at-price data add information about executed/resting activity. They are neither purely “price action” nor traditional indicator analysis.
Order flow also requires careful interpretation; visible liquidity can change and derived delta methods vary by platform.
Options-Derived Context
GEX, DEX, implied volatility, and options open-interest analytics can provide positioning/context references around a futures workflow. These are derived metrics with methodology assumptions, not deterministic price targets.
GEX, DEX, implied volatility and open interest can add positioning context. TensorAlgo's GEX/OI guide explicitly notes that rankings do not guarantee reversal, support or direction and that measurements depend on expiry/methodology.
Which approach is better?
The useful choice depends on the decision. A trader can combine:
- structural price references;
- volume/volatility context;
- a small number of indicators;
- order-flow confirmation;
- explicit risk.
Evaluate the combined rules rather than arguing about labels.
Make discretionary analysis testable
Write observable definitions for “trend,” “rejection,” “breakout,” or “momentum.” Store decision-time examples and evaluate them over a sample.
The more precise the vocabulary, the easier it is to determine whether a tool actually adds value.
Price Action Is Data Too
Price action is not free of transformation or interpretation. Choosing swing points, defining a breakout or deciding when a reclaim is confirmed are analytical operations. The useful distinction is whether the definition is explicit and reproducible.
Indicators as Transformations
A moving average compresses prior prices; RSI transforms relative gains/losses; ATR summarizes range behavior; VWAP combines price and volume. Knowing the input and calculation helps determine whether two indicators add independent information or repeat the same signal.
A Layered Framework
Assign roles: location (VWAP/profile/prior levels), state (trend/balance/volatility), trigger (price behavior), confirmation (order flow if required), risk (invalidation/size). This prevents every indicator from voting on the same question.
Example: Reclaim
A testable reclaim needs a reference level, definition of trade below/through it, a precise return condition, confirmation window and invalidation. “It reclaimed VWAP nicely” cannot be backtested until “nicely” is removed from the rule.
Example: Breakout
Define the range, minimum close/penetration, volume or volatility conditions if used, entry timing and failure condition. Then test whether the indicator filter improves unseen outcomes rather than selecting examples visually after the move.
Order Flow
Depth, Time & Sales and cumulative delta can add information about displayed or executed activity, but feeds and classification methods differ. Spoofing/cancelled liquidity and aggregation mean DOM observations are not guaranteed intent.
Avoid Indicator Redundancy
Test incremental value. If RSI, MACD and two moving-average rules all respond to the same momentum, three confirmations may not be three independent pieces of evidence. Ablation—removing one component—can reveal redundancy.
External Learning
CME Education provides primary educational material on futures products, market mechanics and technical-analysis concepts. Use educational sources to understand mechanics, then validate any trading rule on your own defined dataset.
Choosing a Method
There is no criteria-specific winner. A discretionary price-action process may prioritize visual context; a systematic process may prefer computable transforms. Both need risk management and honest evaluation. See Rule-Based Trading for making either approach testable.
TensorAlgo in a Layered Analysis Workflow
TensorAlgo can place supported market context and user-defined Playbooks alongside a trader's existing charting and execution tools. The useful approach is to give each input a distinct job—location, state, trigger, confirmation or risk—rather than treating more indicators as automatically better. See the Support Center for current functionality.
Define Market Structure
If structure is part of the method, define swing identification, trend criteria and when a break is confirmed. Different swing algorithms can produce different higher-high narratives on the same chart.
Candlestick Patterns
Names such as engulfing bar or pin bar are shorthand, not evidence by themselves. Specify geometry, location and context, then test whether the pattern adds information beyond the underlying price move.
Support and Resistance
Treat levels as references or zones whose response can be observed, not guaranteed barriers. Define how a level is selected and what constitutes acceptance, rejection or invalidation.
Moving Averages
A moving average can describe trend/location or act as a rule input. Choose the lookback and price basis before testing, and compare whether the rule adds value beyond a simpler price-only baseline.
RSI and Oscillators
An oscillator threshold is not intrinsically overbought or oversold in a tradable sense. Trending markets can remain at extreme readings. Define the role—filter, trigger or context—and validate it.
VWAP
VWAP depends on the calculation/reset session. Two platforms can disagree when session templates differ. Record the exact session definition if VWAP is part of a playbook.
Volume Profile
POC, value area, HVN and LVN depend on data and profile boundaries. Use them as measurable references and preserve the profile definition in research.
Multi-Timeframe Analysis
Higher-timeframe context can reduce ambiguity but creates timing issues. A higher-timeframe bar is not complete until close. Historical tests must not use its final value early.
Confluence
Confluence is useful only when components contribute distinct evidence. Three correlated momentum indicators do not necessarily provide three independent confirmations.
Testable Discretion
Create decision-time examples, blind review where possible and inter-rater comparisons. If two skilled reviewers disagree constantly, the discretionary definition may need clearer boundaries.
Comparison Framework
Compare approaches by reproducibility, data requirements, latency, interpretability, robustness and demonstrated incremental value. There is no universal winner.
Related Reading
Use Rule-Based Trading to formalize either method and Trading Journal Guide to preserve decision-time examples.
Build a Non-Redundant Evidence Stack
The practical question is not whether price action or indicators are “better.” It is whether each input contributes information that changes a decision. A moving average derived from price and a second moving average with a nearby lookback may look like two confirmations while largely describing the same underlying movement. Likewise, several oscillators can be highly correlated transformations of the same returns.
A cleaner framework assigns each input a job:
| Evidence layer | Example | Question it should answer | | --- | --- | --- | | Structure | prior high/low, range, breakout | Where is price relative to a defined reference? | | Participation | volume, order flow | Is activity changing around that reference? | | Relative value | VWAP, profile | Where is price relative to a volume-weighted/session reference? | | Regime | volatility, trend/balance rule | Which playbooks are eligible? | | Trigger | reclaim, rejection, break/retest | What observable event authorizes action? |
This makes confluence testable. If removing one layer does not materially change decisions or results, it may be decoration rather than useful evidence.
The Futures Trading Glossary provides definitions for VWAP, volume profile, cumulative delta and common structure terms. The Gamma and GEX guide is a separate example of contextual analytics: options-derived positioning can add context, but it should not be treated as another version of price action or as a guaranteed directional signal.
Turn Visual Judgment Into Testable Language
“Strong support” is difficult to audit. “Price traded below the prior-session low, closed back above it, and held above the level for the next defined observation window” is more testable. Discretion does not have to disappear; the goal is to identify which part is objective and which part remains judgment.
For each setup, write the location, context, trigger, invalidation and management separately. The Trading Playbook guide shows how that structure reduces hindsight. The Rule-Based Trading guide takes the next step by defining required conditions, supporting evidence and vetoes.
Multi-Timeframe Analysis Without Double Counting
Higher and lower timeframes can answer different questions, but repeated views of the same movement are not independent confirmation. A useful hierarchy might use a higher timeframe to classify broad structure, the execution timeframe to define location and trigger, and a faster view only when it supplies genuinely different execution information.
The same principle applies to indicators. Use the smallest set that represents distinct hypotheses, then validate those hypotheses with historical and forward evidence. The Backtesting Guide explains how repeated parameter experimentation can overfit historical noise.
Primary-Source Check
When an analysis depends on contract mechanics, session hours or tick values, verify the current exchange specification rather than relying on an indicator template. CME Education provides futures education and product resources, while CFTC Learn & Protect covers derivatives mechanics and risk. Technical analysis describes market observations; it does not remove leverage, liquidity or execution risk.
Example: One Level, Several Evidence Types
Suppose price approaches the prior-session high. Price action can describe the location and whether price rejects, accepts or reclaims the level. Volume can describe participation around the interaction. VWAP can show where that interaction sits relative to the session's volume-weighted reference. A volatility measure can indicate whether the day's movement is compressed or expanded.
Those observations should not automatically become four votes for the same trade. Write the hypothesis each one represents. If the volume and price-action conditions are simply two descriptions of the same event, count them accordingly. If a volatility filter determines whether the playbook is eligible at all, treat it as a regime condition rather than an entry confirmation.
When indicators help most
Indicators are particularly useful when they standardize a quantity that is difficult to compare visually across days: volatility, distance from a reference, rolling momentum or volume-weighted location. Their value comes from consistent measurement, not from hiding the underlying price data.
When raw structure helps most
Raw structure is useful when the decision depends on exact location, sequence and invalidation: whether a prior high was swept, whether a breakout held, or whether a reclaim occurred. The important step is still to define those terms before reviewing the outcome.
A mature process can therefore combine both approaches without ideological commitment. Start with the market question, choose the smallest set of measurements that answer distinct parts of it, and remove inputs that do not change decisions or improve validated results.
A Practical Selection Rule
Before adding any indicator or visual concept, write the decision it is supposed to improve. Then compare the process with and without it across historical and forward observations. Keep the input only if it adds distinct, stable information or materially improves consistency of execution.
This prevents indicator accumulation, where a chart becomes more complex without increasing decision quality. It also keeps price action honest: discretionary labels such as rejection, acceptance or momentum should face the same requirement for definition and evidence.
The strongest analytical stack is usually not the one with the most overlays. It is the one in which every layer has a documented purpose, does not merely duplicate another layer, and can be removed when evidence no longer supports its usefulness.
Keep Definitions Portable
Define analytical concepts independently of one chart template. A reclaim, volatility filter or VWAP condition should mean the same thing when reviewed historically, observed live or implemented in code. Portable definitions make research reproducible and reduce the chance that a visual preference quietly changes the strategy.
Review the Stack Periodically
Markets and workflows change. Revisit each analytical input periodically and ask whether it still answers a distinct question, whether its calculation changed, and whether the evidence supporting it remains current. Removing redundant inputs can improve clarity just as much as adding a new tool.
Frequently Asked Questions
Is price action a form of technical analysis?
Usually, yes. Price action focuses on raw price structure and behavior, while technical analysis is a broader category that can also include indicators, volume and statistical transforms.
Is price action better than indicators?
There is no universal winner. The useful question is whether each input contributes distinct, testable information to a defined decision.
Are lagging indicators useless?
No. Many indicators summarize historical observations, and many price-action patterns also require completed observations. A lag is only a problem if it conflicts with the decision horizon.
Can price action and indicators be combined?
Yes. Give each component a clear role—such as location, state, trigger or confirmation—and test whether the combination adds value without double-counting the same information.
Final Takeaway
Price action and indicators are tools for describing market information, not competing belief systems. Give each input a defined job, avoid redundant confirmation and turn discretionary language into definitions that can be reviewed and tested.